
NFL Betting Metrics That Matter: EPA, DVOA and Beyond for UK Punters
 Available in US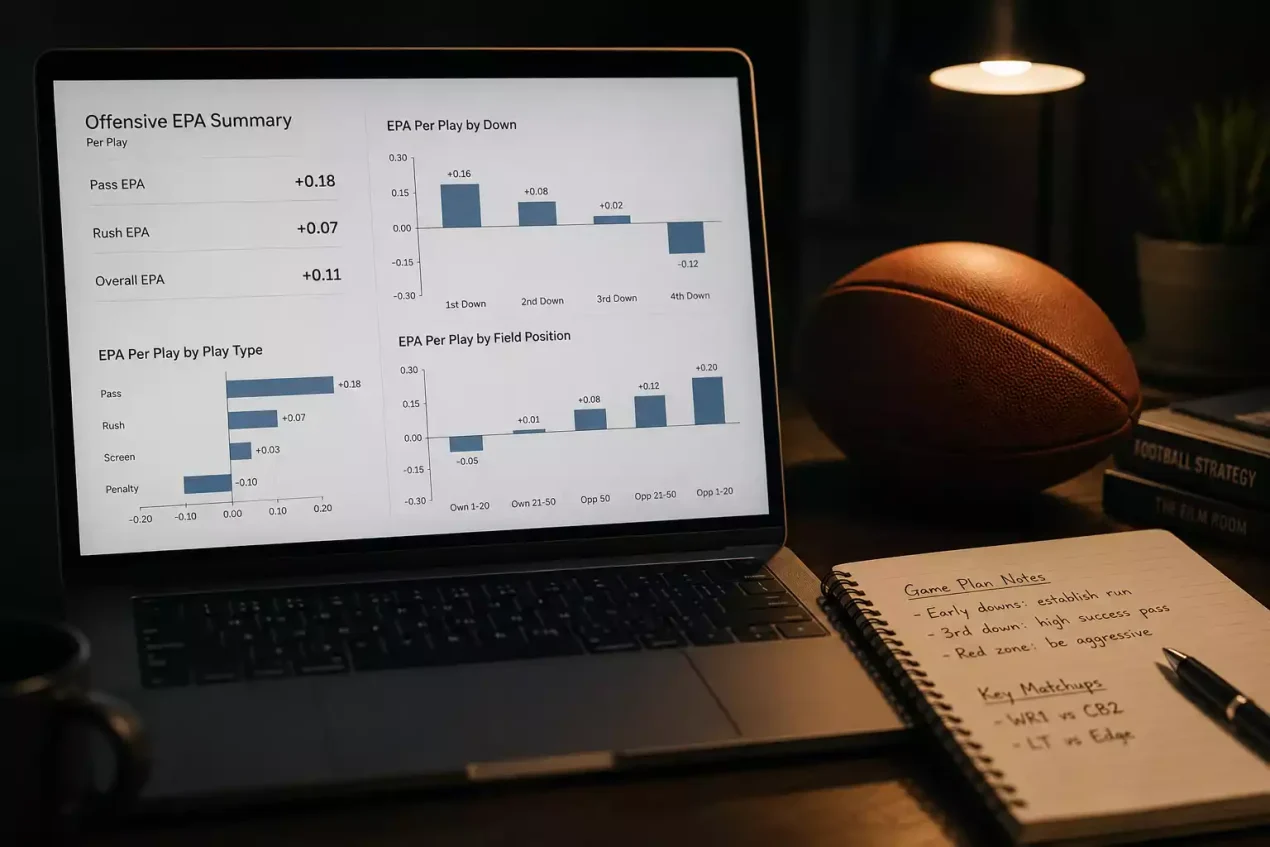
For my first five years of NFL betting, I used the same metrics every casual fan uses: yards, touchdowns, win-loss record. They felt informative. They were not. A quarterback who throws for 350 yards in a blowout loss looks great in the box score but tells you almost nothing about how the offence actually performed in meaningful situations. The game changed for me when I discovered Expected Points Added — a single number that answered the question I had been fumbling around for years: how much did this play actually move the needle?
Advanced NFL metrics are the sharpest informational edge available to UK punters. None of the top-10 competitor sites in this niche mention EPA, DVOA, or CPOE by name. They tell you to “study the stats” without specifying which stats matter or where to find them. That gap is your opportunity. The metrics in this guide are freely available, updated weekly during the season, and directly applicable to spread, total, and prop betting decisions.
Expected Points Added (EPA): The Single Most Useful NFL Metric for Bettors
EPA measures the value of every play in the NFL by calculating how much each play changed the expected points outcome for the offence. Every game situation — down, distance, field position, score margin, time remaining — carries an expected point value based on decades of historical data. A first-and-10 at your own 25 is worth a certain number of expected points. If the next play is a 15-yard pass completion, moving to the 40, the new expected point value increases. The difference between the two values is the EPA of that play.
Why does this matter for betting? Because EPA strips away the noise that raw stats carry. A team that gains 400 yards but scores only 17 points had a lot of “empty” yardage — yards gained in low-leverage situations that did not translate to scoring. EPA captures that distinction. A team with fewer yards but higher total EPA was more efficient when it mattered, and efficiency is what predicts future performance better than volume.
For spread betting, EPA per play is the metric I check first. Teams with consistently high offensive EPA per play and low defensive EPA allowed per play are genuinely good, not just good-looking in the box score. When a team’s EPA profile diverges from its win-loss record — say, a 6-5 team with top-10 EPA on both sides of the ball — the market may be undervaluing them because public perception is anchored to the record. That divergence is a spread betting angle.
For totals, offensive EPA combined with pace data gives you a clearer picture than raw scoring averages. A team averaging 24 points per game with high EPA is likely to sustain that scoring; a team averaging 24 points per game with low EPA has been getting lucky and is due for regression. Regression is the bettor’s friend when the market has not yet priced it in.
DVOA, CPOE and Success Rate: Advanced Stats Worth Tracking
DVOA — Defence-adjusted Value Over Average — measures a team’s efficiency on every play, adjusted for the quality of the opponent. A team that dominates a weak schedule will have inflated raw stats but a more modest DVOA. A team that grinds out results against strong opponents will have a DVOA that exceeds what its record suggests. The adjustment for opponent quality is what makes DVOA more predictive than raw efficiency numbers.
DVOA breaks down into offensive, defensive, and special teams components, and each is useful for different bet types. Offensive DVOA correlates with scoring and points-based markets. Defensive DVOA correlates with opponent scoring and is particularly useful for player props — a wide receiver facing a defence with poor pass-coverage DVOA is more likely to exceed his yardage line than the raw matchup suggests. Special teams DVOA is the most volatile and least predictive component, but extreme values (a team with historically bad punt coverage, for example) can flag value in niche prop markets.
CPOE — Completion Percentage Over Expected — measures how often a quarterback completes passes compared to what the difficulty of those passes would predict. A quarterback with a 67% completion rate sounds good until you learn that his average throw difficulty predicted a 69% completion rate, giving him a CPOE of -2%. That quarterback is actually performing below expectation, and his raw completion percentage is flattering him. CPOE is most useful for passing props and for identifying quarterbacks who are outperforming or underperforming their true ability — regression candidates in both directions.
Success rate is the simplest advanced metric: the percentage of plays that achieve a “successful” outcome, defined as gaining at least 50% of needed yards on first down, 70% on second down, and 100% on third or fourth down. Success rate is a baseline efficiency measure that correlates strongly with winning. Teams with a success rate above 48% tend to be above-.500; teams below 42% tend to struggle. For betting, success rate is a quick check — if a team’s success rate and its record are aligned, the market is probably pricing them correctly. If they diverge, investigate further.
Where to Access NFL Analytics Data for Free
The good news for UK punters is that nearly all the metrics described above are available for free, updated weekly, and accessible from any browser. In 2025, 89 of the 100 most-watched US television programmes were NFL games, which means the analytical ecosystem around the sport is enormous — far larger and more open than the equivalent resources for Premier League or Champions League betting.
Play-by-play EPA data is published on several open-source analytics platforms that aggregate official NFL play data and calculate EPA, success rate, and related metrics for every team and player. These sites typically offer sortable tables, visualisations, and downloadable datasets. You do not need to run your own calculations — the community has already done the work.
DVOA is published weekly during the NFL season on dedicated analytics sites that have been calculating the metric since the early 2000s. The full breakdown by offensive, defensive, and special teams DVOA is freely available, along with opponent-adjusted rankings that are far more useful than the raw NFL standings for betting purposes.
CPOE and other quarterback-specific metrics are available on sites that specialise in passing analytics. These sites pull from the same official data sources and present CPOE alongside related metrics like air yards per attempt, average depth of target, and pressure rate — all of which contribute to a complete picture of quarterback performance.
The global sports betting market is projected to reach $125.12 billion in 2026, and the punters capturing a disproportionate share of that market’s edge are the ones using data that most bettors ignore. You do not need a subscription, a degree in statistics, or proprietary software. You need a bookmark folder, 30 minutes per week, and the willingness to let numbers override narratives. For a practical framework on applying these metrics week by week, the weekly analysis guide walks through the full process.
Numbers Do Not Lie, But They Do Require Context
Advanced metrics are tools, not oracles. EPA, DVOA, and CPOE will not tell you who wins a game — they will tell you which team is playing better than its record suggests, which matchups favour the over, and which quarterback is due for regression. The value comes from combining these metrics with the situational factors — injuries, weather, schedule position — that the numbers alone cannot capture. Use the data to sharpen your view, not to replace it.
Do I need to understand advanced metrics to bet profitably on the NFL?
No. Many successful NFL bettors use simpler approaches — situational analysis, line shopping, and bankroll discipline — without ever looking at EPA or DVOA. However, advanced metrics provide an informational edge that is freely available and underused by the general betting public. If you are willing to spend 20-30 minutes per week reviewing the data, it can meaningfully improve your ability to identify mispriced lines.
Which free NFL analytics sites update in real time during the season?
Most free analytics sites update within 24-48 hours of game completion. Play-by-play data typically processes overnight after Sunday and Monday games, with updated EPA, success rate, and CPOE tables available by Tuesday morning. Real-time in-game analytics require paid tools, but weekly updates are more than sufficient for pre-game betting analysis.
This material was created by the GridPunt team.
Related posts

NFL Betting Market Outlook for UK Punters: Trends Shaping 2026 and Beyond

NFL Betting Mistakes to Avoid: Errors That Cost UK Punters Money